Growing pains: How is Kamloops responding to urban sprawl?
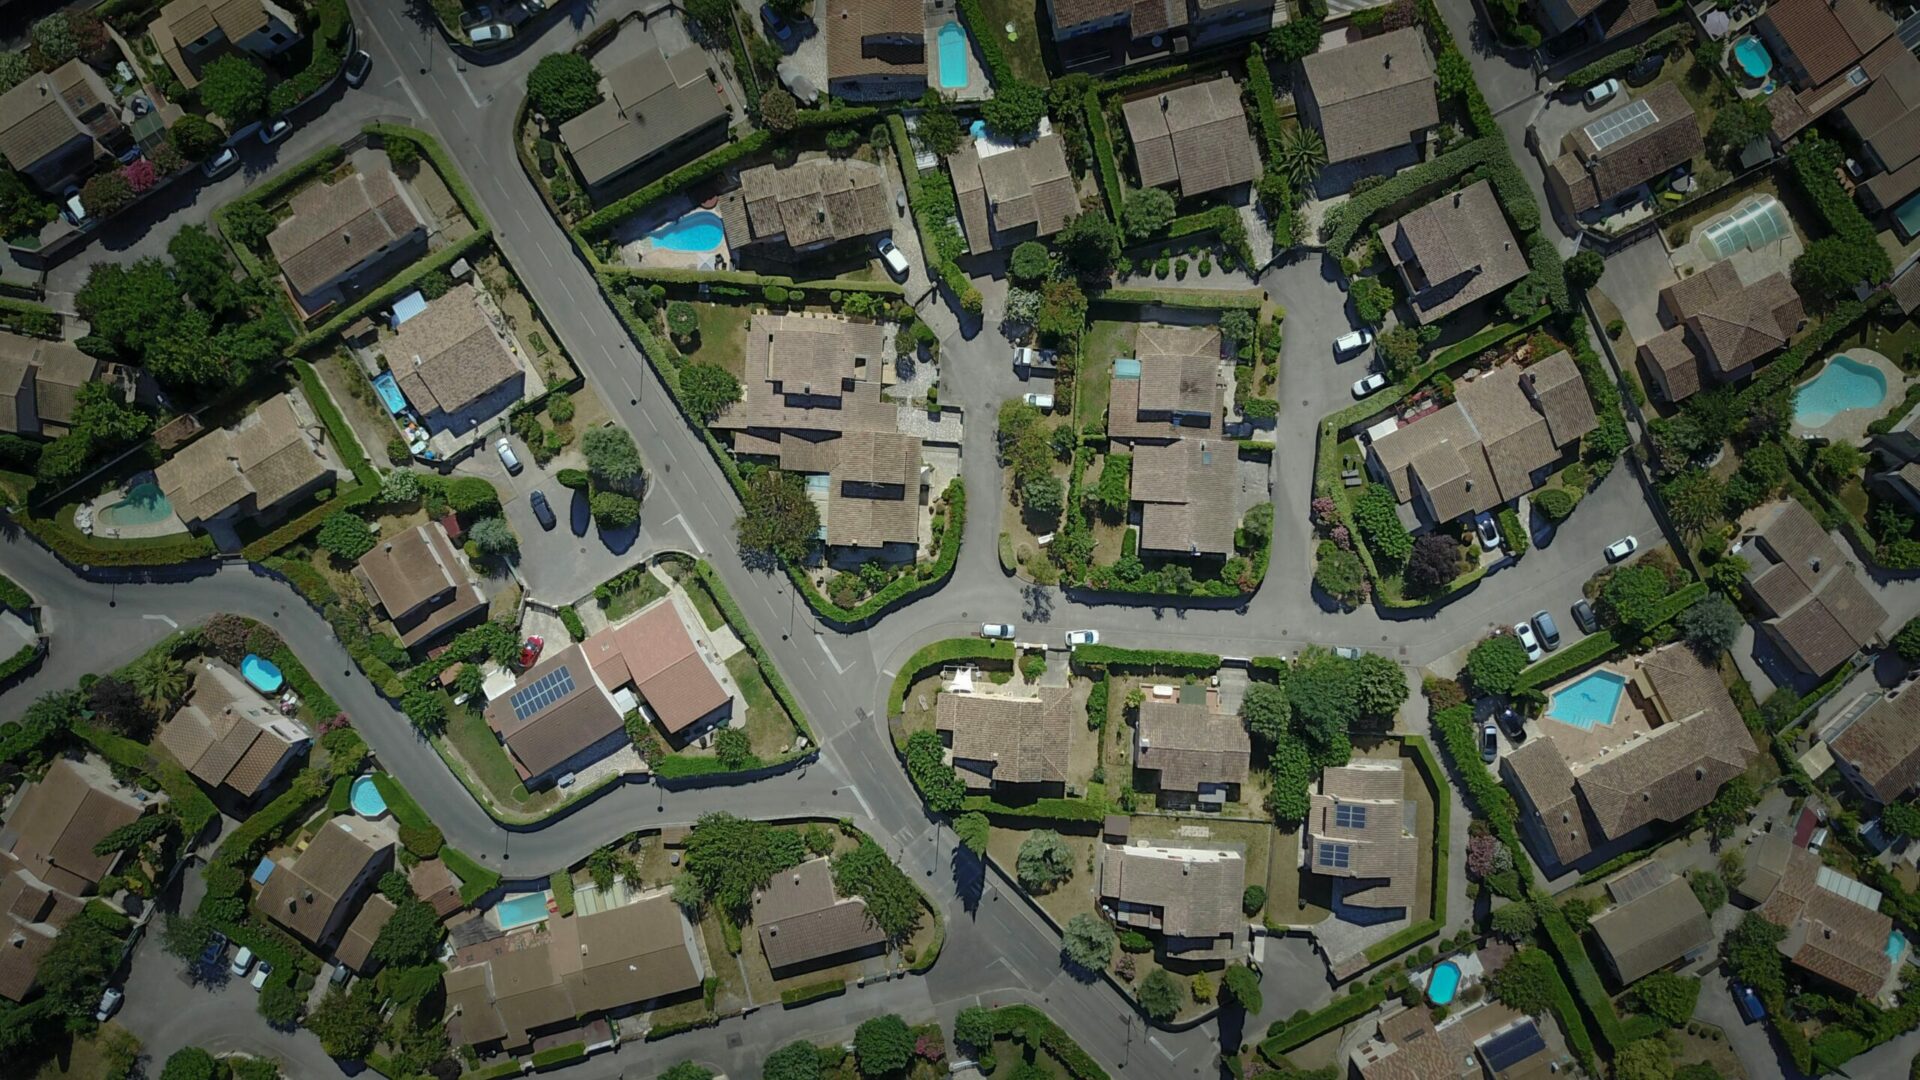
Photo by Raphaël Biscaldi on Unsplash
Two mornings, one city
Scene one:
At 7:15 a.m., she grabs her bicycle and rides through streets shaded by old trees, arriving within minutes at her neighbourhood café where the barista greets her by name. She chats briefly with a neighbour about weekend plans and the upcoming school meeting for their children: the small moments that weave the community together. Cycling along dedicated bike lanes, she feels the breeze, hears birds singing. She spots a friend on the sidewalk — just enough time to exchange a smile and a quick wave. Passing a small park, a bookstore, and a bus stop, she experiences a city that feels human in scale, where distances are short and everyday life is tangible. Time is not “dead time” for her—it is time lived and experienced. After about half an hour, she reaches her downtown workplace without traffic or parking worries, making her commute an active and engaging part of the day.
Scene two:
At 7:00 a.m., he steps into the garage and starts the car, the engine echoing in the enclosed space. He drives along wide, empty streets to a plaza, joins the drive-through line with engine idling, and orders coffee through a speaker. A few metres ahead, a barista hands him his coffee through a small window, with no time for a “good morning.” The next car waits, the barista rushes, and the whole exchange feels faceless. At a red light, he sips his coffee and watches passing cars through his windshield. He arrives at work, parks in the garage, and rides the elevator up to his office. Everything unfolds within enclosed spaces —car, parking, elevator. He remembers that after work he needs to do thirty minutes of cardio at the gym, as his doctor recommended.
Both individuals live in the same city, yet the quality of their daily lives differs. One experiences and touches the city; the other moves through it. The difference between these two workdays is not simply a matter of personal lifestyle choice, it reflects the built environment. The first reflects life in an infill and compact neighbourhood and the second takes place in a sprawling suburban context.
Urban sprawl refers to the outward expansion of urban development at a pace that exceeds population growth, typically producing low-density residential areas on the urban fringe. This form of development is often characterized by dispersed settlement patterns, single-use zoning, and a separation of residential areas from employment and services. Urban sprawl is commonly associated with inefficient land consumption, as it uses more land per person over time (OECD, 2014). It is also linked to higher levels of car dependency, longer commute times, and reduced accessibility for non-drivers. In addition, sprawl has been connected to reduced ability to connect with nature, poorer air quality, increased traffic accidents, and negative public health outcomes, including obesity, chronic disease, and social exclusion (Jaeger and Nazarnia, 2016; Luan and Fuller, 2022).
How is Kamloops growing?
Like many mid-size Canadian cities, Kamloops has historically developed under zoning frameworks that favored single-use, low-density residential neighbourhoods. Growth was often equated with larger homes, cul-de-sacs, expanded road networks, and peripheral subdivisions; this led to extensive strip malls, large surface parking lots, drive-through-oriented commercial areas, and residential expansion into forested areas at the city’s edge. Transportation patterns in Kamloops reflect the effects of dispersed urban form. As of 2021, nearly 88% of commuters in the city traveled to work by private vehicle, a rate approximately 10% higher than the provincial average (Statistics Canada, 2021).
Population density is a widely used indicator of urban compactness. As of 2021, Kamloops had a density of 329 people per square kilometre and is experiencing a moderate but steady increase in density of approximately 0.6% per year. This rate places the city in a transitional position—between faster-growing urban centres and slower growing communities. Although Kamloops does not exhibit the strong densification trends seen in cities such as Kelowna or Chilliwack, its consistent upward trajectory suggests gradual urban intensification and a shift toward more compact development patterns.
However, Kamloops’ geographic context significantly shapes its urban form. Located at the confluence of the Thompson Rivers, the city has a large municipal boundary that encompasses steep slopes, silt bluffs, floodplains, areas of high wildfire risk, extensive hillsides, agricultural land reserves, river corridors, grasslands, and other environmentally constrained lands. Unlike municipalities such as Nanaimo, Penticton, or Courtenay—whose boundaries more closely align with developed areas—Kamloops spans a broad and varied landscape, where the physical constraints have contributed to a multi-nodal urban structure that complicates the efficient provision of public transit and active transportation infrastructure (Figure 1).
Figure 1- Trend of Population Density in Kamloops Compared with Peer Cities Over 20 Years
Source: based on Stats Canada (2001 to 2021)
But the consequences of sprawl extend beyond mobility. As cities spread outward, land cover changes. Natural systems are altered. Urban expansion can disrupt local microclimates, water cycles, and biodiversity, and may reduce the availability and quality of habitats for plant and animal species.
What 24 years of growth in Kamloops reveals
One way to understand the impacts of sprawl is through Vegetation Dynamics: a measure used to track changes in land cover and assess the overall environmental health of growing cities (Figure 2). Higher values (shown in blue spectrum) indicate dense, healthy vegetation, while lower values (shown in yellow spectrum) point to sparse, stressed, or missing plant cover. Visual comparison of vegetation dynamics in Kamloops over a 24-year period shows how vegetation declined in newly developed peripheral neighbourhoods such as Aberdeen, Juniper, Westsyde, and Valleyview. Areas that had dense and healthy vegetation in 2000 (shown in blue spectrum) show much less greenery by 2024 (shown in yellow spectrum), a change caused by new construction and the spread of the city.
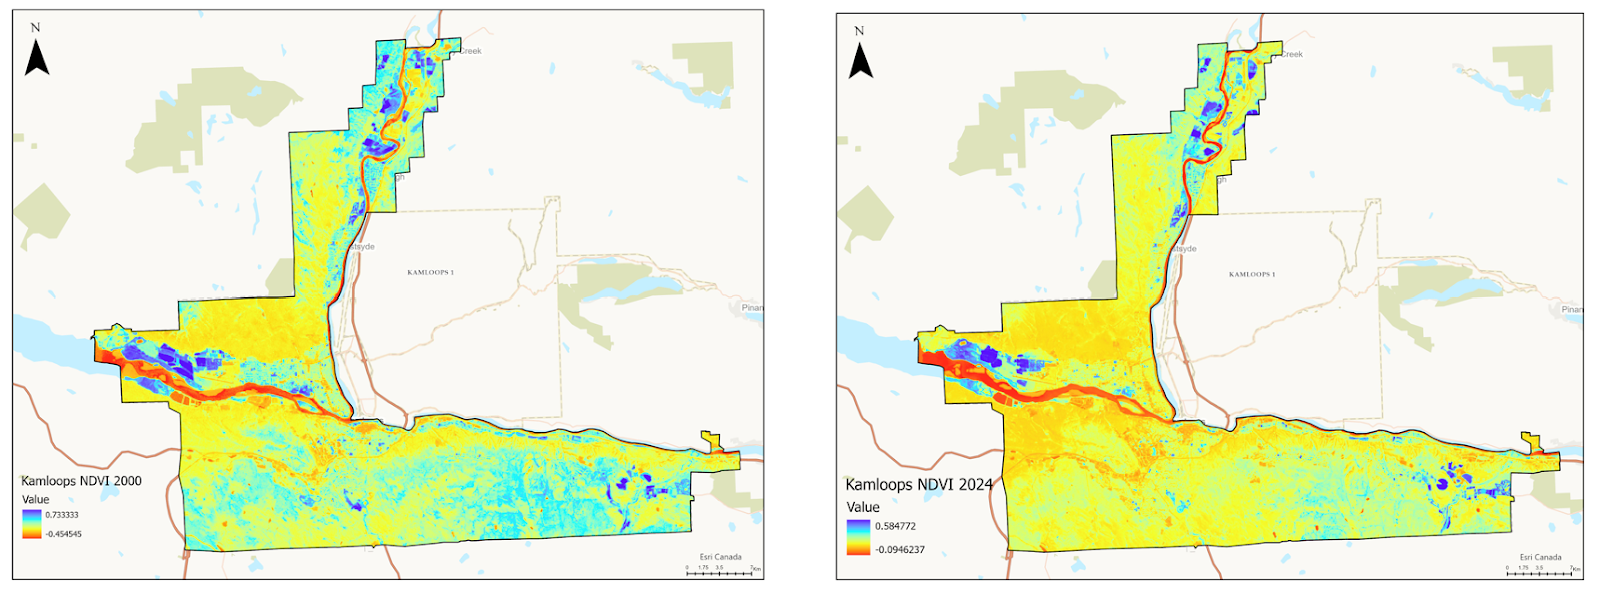
Figure 2- Comparison of Vegetation Presence Across the City in 2000 and 2024
Source: Author’s analysis based on Landsat 7 and Landsat 8/9 data (September 2000 and 2024). GIS resources provided by Simon Fraser University.
At the citywide scale, however, results suggest that while housing pressures have reduced vegetation in fringe areas, vegetation densification across large undeveloped or managed landscapes has outweighed localized losses. Approximately 53% of Kamloops’ land saw an increase in vegetation (shown in blue). Another 28% of the land remained largely unchanged (shown in gray), while 19% experienced a decline in vegetation (shown in yellow) (Figure 3). This pattern could be explained by the natural resilience of local plant species in large natural areas, which allows vegetation to recover over time, and by the management of parks and open spaces, which helps offset vegetation losses in developed areas.
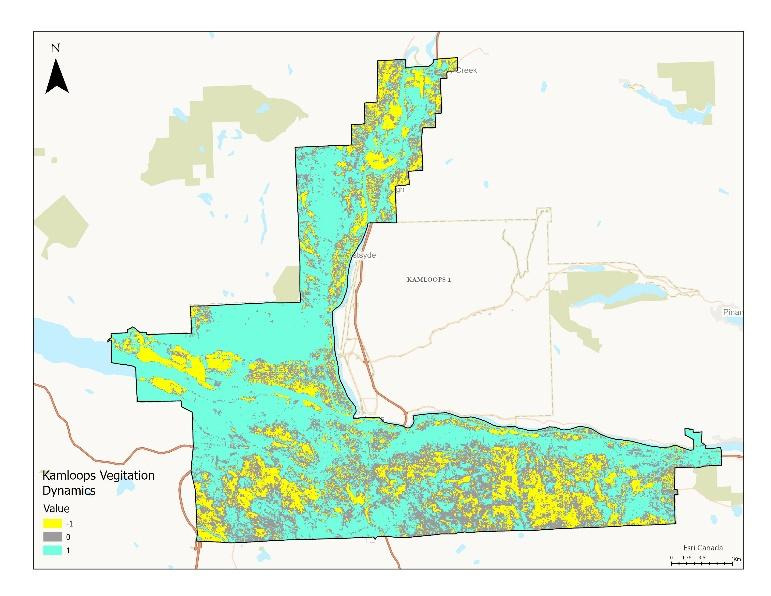
Figure 3- Vegetation Dynamics in Kamloops, 2000–2024
Source: Author’s analysis based on Landsat 7 and Landsat 8/9 data (September 2000 and 2024)
GIS resources provided by Simon Fraser University
Who pays for sprawl?
Sprawl places significant long-term burdens on municipal finances. Low-density housing at the urban edge usually costs more to service per household than higher-density development, because infrastructure such as roads, water pipes, and sewer lines must extend over longer distances. While developers pay fees to cover part of these costs—known as Development Cost Charges, which are often reflected in housing prices—many infrastructure expenses, particularly long-term maintenance such as fixing watermain breaks, road maintenance, and snow plowing, remain the responsibility of the municipality. As a result, lower-density housing that is more expensive to service is under-priced, at the expense of higher-density dwellings, which are over charged. Political will is usually to defer the cost to the future. In addition, because most road use is free of charge, taxpayers have effectively subsidised long-distance car commuting and continue to do so through ongoing public expenditures on road maintenance, repair, policing and so on (North of Somewhere, 2025).
Towards growing wisely: Directing growth toward the core
Municipalities manage sprawl using a mix of bylaws, policies, and incentives to guide development toward more compact and efficient patterns—from the permanent growth boundary in Kelowna to the unused land tax in Tallinn, or the building obligations in Rothenbrunnen. Given the geography of Kamloops, which has already shaped multi-nodal and dispersed neighborhoods, there are some policy and regulatory frameworks in place that discourage further sprawl:
- As mentioned, developers pay development charges, but are these charges the same for all types of development? The City of Kamloops’ Development Cost Charge Bylaw differentiates costs based on the location of new development. Rates for multi-family projects in the Core Area—which includes downtown, the North Shore, and designated town centres—are lower. As a result, higher-density and more compact developments in the Core may face lower per-unit development cost charges compared to projects built on the urban fringe. The updated bylaw is expected to come in front of Council in March 2026.
- What about tax incentives? Under the City’s Revitalization Tax Exemption Bylaws—for hotel and motel redevelopment, as well as for specified areas in the city centre and the North Shore—eligible developments may receive a 100% exemption on the municipal portion of taxes applied to the increase in assessed improvement value for up to 10 years.
- The newly adopted Official Community Plan (2025) projects that roughly 35% of future housing growth will take place in the Core Sector and anticipates that 48% of new housing over the next 20 years will be in high-density forms. The plan clearly distinguishes between developments in already serviced areas and those on the urban fringe, with the majority of anticipated 20-year growth—around 70%—expected to occur within established, serviced neighbourhoods.
- Transit-Oriented Areas (TOAs) have been designated within 400 metres of major transit exchanges at Lansdowne, North Shore, and Thompson Rivers University. These areas support higher-density residential development near transit. A proposed Transit-Supporting Area near the potential Valleyview Transit Exchange also aims to transition auto-oriented land uses toward a mixed-use, transit-supportive urban form.
- To promote complete and compact neighbourhoods, the city’s Official Community Plan concentrates growth within mixed-use areas, including town centres. Residential land use policies also prioritize walkability, access to daily needs, and proximity to transit. New developments are required to occur in well-serviced areas with integrated transportation design, including sidewalks, cycling routes, multi-use pathways, and transit connections. Larger developments must connect to surrounding active transportation networks, while poorly serviced areas are discouraged from accommodating new residential growth.
While Kamloops’ policies and bylaws provide a framework on paper to encourage infill, compact and transit-oriented growth, the real test lies in how the market responds and how consistently the political will supports sustainable growth. Developers usually express concerns that land policies by themselves may not resolve development challenges. Intensification projects are often less profitable and harder to finance than undeveloped-site or suburban development, partly because of higher cost for land assembly, and elevated land prices. Political factors, including voter preferences and election timing, can influence how successful intensification initiatives are. Translating these plans into action requires consistent enforcement and alignment between market forces and the city’s goals for a livable, efficient, and resilient urban form. Kamloops’ core area has historically been shaped by the confluence of the North and South Thompson Rivers — a defining geographical feature that has long contributed to the city’s identity and character. Cities that benefit from such a strategic setting have strong potential to successfully implement downtown intensification, provided that there is adequate investment in amenities and infrastructure to enhance the attractiveness and public perception of living in the core rather than in suburban areas (Graham et al., 2024). This potential is especially significant in Kamloops given the presence of Thompson Rivers University; it attracts a population of young professionals to the city which creates additional capacity for cultivating an energetic, inclusive, and engaging urban core. The year 2030 is the target for achieving a 30% reduction in community greenhouse gas emissions and for updating the next Official Community Plan. Hopefully, over the next roughly five years, day by day, more residents can experience a morning where walking, cycling, and spontaneous social interactions are part of everyday routines, where the city feels alive, welcoming, and truly ours.
Acknowledgment
Thanks to Simon Fraser University for the use of GIS resources.
References:
Graham, R., Momer, B., Filion, P. (2024). Sprawl to tall: Lessons from Kelowna as a blueprint for downtown intensi-fication in mid-sized cities, Canadian Journal of Urban Research (33):2-16-36
Jaeger JAG, Nazarnia N.(2016). Social and ecological impacts of the exponential increase of urban sprawl in Montréal. Can Comm Dis Rep; 42:207-8.https://doi.org/10.14745/ccdr.v42i10a07
Luan, H., Fuller, D. (2022). Urban form in Canada at a small-area level: Quantifying “compactness” and “sprawl” with bayesian multivariate spatial factor analysis, EPB: Urban Analytics and City Science, Vol. 49(4) 1300–1313. DOI: https://doi.org/10.1177/23998083211062901
OECD (2014). Deconstructing Canada’s Housing Markets: Finance, Affordability and Urban Sprawl” (Calista Cheung, OECD Economics Department Working Paper No. 1145, 2014).
North of Somewhere (2025). We built a city we can’t afford. https://www.youtube.com/watch?v=VIRGI5FLZps
U.S. Geological Survey. (2024). Landsat7, 8/9 imagery for Kamloops, [September 2000–2024].
Transition Kamloops
Transition Kamloops is a volunteer-driven, registered not-for-profit society focused on increasing local resilience and self-sufficiency in food, water, energy, culture and wellness. We emphasize a local economy, healthy ecosystems, and grassroots community building, while reducing our dependence on fossil fuels. We believe in a better way: a community that sustains life in all its diversity, strives for equality and justice and invests in the future.
Transition Kamloops recognizes that we are living on Secwépemcul’ecw—land that was never ceded to settlers, and continues to be home to vibrant Indigenous cultures, languages, and traditions. We acknowledge the impact of colonization, forced displacement, and ongoing struggles faced by Indigenous peoples. We commit to listening, learning, and building positive relationships with Indigenous communities as we work towards reconciliation.
My Blog Posts